
Home / Corporate Mobility Journey

From data to impact

Corporate MobilityTransformation Journey

A structured journey to higher value, more sustainable and people-centric mobility.

Understand where you are today. Build the case for change. Turn your ambition into lasting business impact.

Explore the journey
01

Mobility Assessment

Understand your Corporate Mobility.

Bring your mobility data together to reveal how people move, what they need and where the opportunities are.

Employees

Where do they live, how do they travel, and what are their needs?
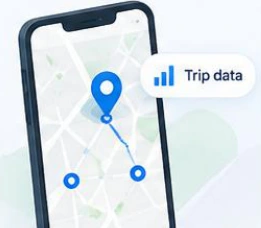
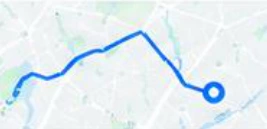
GPS

Real travel patterns and routes.

Bus routes

Existing shuttle routes and usage.

Parking

Parking capacity and utilization.

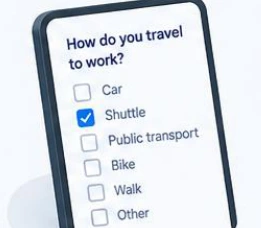
Travel survey

Employee preferences and feedback.

A connected baseline

Current Mobility Profile

Illustrative profile

Modal split

  • Car 48%
  • Shuttle 28%
  • Public transport 12%
  • Bike 8%
  • Walk 4%

Understand your mobility patterns

Connect employee origins, main corridors and peak travel times to reveal where mobility services are needed most.

2,346Employees analyzed
178Unique origins
12Main corridors
285 tEstimated CO₂ / month

Employee origins

Peak travel times

678916171819

Illustrative patterns · hours of the day

Discover your Corporate Mobility maturity.

Identify your current position, your gaps and your highest-value opportunities.

Start Your Mobility Assessment →
02

Mobility Maturity

From fragmented mobility to strategic advantage.

Understand where you are today, what data you have and how to move to the next level.

LEVEL 5

Strategic Mobility

“Mobility creates competitive advantage.”

5Strategic MobilityBUSINESS IMPACT ↑

Data at this level

  • Strategic KPIs and benchmarking
  • ESG and CO₂ reporting
  • Scenario modelling and investment planning
  • Real-time performance analytics
  • Continuous optimization with AI

Business impact

  • Competitive advantage
  • Sustainable growth
  • Industry leadership
LEVEL 4

Optimized Mobility

“We continuously improve mobility.”

4Optimized MobilityOPTIMIZATION ↑

Data at this level

  • Real-time operational data
  • Occupancy and demand patterns
  • Predictive analytics
  • Optimization scenarios
  • Employee feedback integration

Key outcomes

  • Higher utilization
  • Lower cost per employee
  • Lower emissions
  • Higher employee satisfaction
LEVEL 3

Data-Driven Mobility

“We understand why it happens.”

3Data-Driven MobilityINTELLIGENCE ↑

Data at this level

  • Employee origin-destination data
  • Travel behaviour and modal split
  • Shuttle and public transport usage
  • Cost and emissions data
  • Travel survey results

Key outcomes

  • Fact-based decisions
  • Clear mobility insights
  • Identified opportunities
  • Measurable impact
LEVEL 2

Managed Mobility

“We know what happens.”

2Managed MobilityINSIGHTS ↑

Data at this level

  • Shuttle ridership and routes
  • Fleet and operational data
  • Basic cost information
  • Employee lists and locations
  • Manual reporting

Key outcomes

  • More control
  • Improved efficiency
  • Fewer ad-hoc decisions
  • Better employee communication
LEVEL 1

Reactive Mobility

“We don’t know how employees travel.”

1Reactive MobilityDATA ↑

Data at this level

  • Fragmented information
  • No consistent employee travel data
  • Limited or no ridership data
  • Manual processes and spreadsheets
  • Decisions based on assumptions

Key outcomes

  • Low control and visibility
  • High costs and emissions
  • Inefficient services
  • Dissatisfied employees
Today
03

Mobility Business Case

From mobility investment to business value.

A connected value chain that turns mobility data into measurable business impact.

Illustrative business case · figures from the reference, not guaranteed results

01

Mobility Investment

Understand your current mobility costs and needs.
  • Shuttle & fleet
  • Company cars
  • Parking
  • Public transport
  • Other mobility
R$12.5MAnnual mobility spend100%Cost visibility
02

Mobility Intelligence

Integrate data and get a clear view of how people travel.
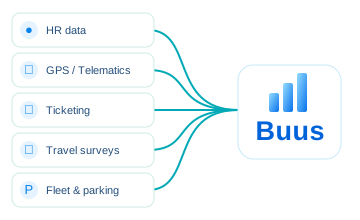
  • HR data
  • GPS & telematics
  • Ticketing
  • Travel surveys
  • Fleet & parking
5+Data sources100%Data integration
03

Operational Excellence

Turn insights into actions and optimize your mobility services.
  • Optimized routes
  • Higher occupancy
  • Right vehicle size
  • Better scheduling
  • Improved contracts
−20%Operational costs+30%Vehicle occupancy
04

Employee Experience

Provide a more reliable, convenient and sustainable commute.
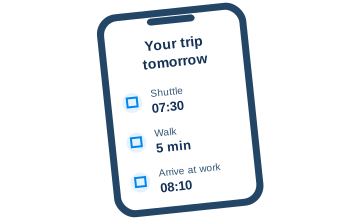
  • Shorter travel time
  • Higher reliability
  • Greater comfort
  • Increased safety
  • Higher satisfaction
+25%Employee satisfaction−15%Absenteeism
05

Strategic Value

Enable a more productive, sustainable and resilient business.
  • Higher productivity
  • Lower CO₂ emissions
  • Stronger talent attraction & retention
  • Greater resilience
  • Competitive advantage
−40%CO₂ emissionsR$8.3MEstimated annual value
DataInsightsDecisionsOptimizationBusiness impact

A continuous cycle for a stronger tomorrow.

04

Strategic Mobility Plan

From vision to action.

Translate your mobility ambition into a clear, phased roadmap with prioritized initiatives that deliver measurable business value.

Corporate goals

Align mobility with your organizational priorities.

Higher productivity

Enable people to work and move efficiently.

Better employee experience

Attract and retain talent.

Lower mobility costs

Do more with the same or less.

Lower CO₂ emissions

Meet ESG targets.

Greater resilience

A future-proof and flexible mobility ecosystem.

Strategic initiatives

Prioritize the initiatives with the greatest impact.

Optimize shuttle services

Increase occupancy and efficiency.

Integrate public transport

Seamless multimodal access.

Mobility budget program

Flexible and inclusive mobility.

Electrify fleet and infrastructure

Reduce emissions and future-proof.

Smart parking strategy

Manage demand and free up space.

Data, AI and continuous optimization

Monitor, learn and improve.

A roadmap that moves you forward.

Illustrative sequencing
InitiativeQuick wins0–6 monthsBuild6–24 monthsScale2–5 years
Optimize shuttle servicesLaunchDevelopScale
Integrate public transportLaunchDevelop—
Mobility budget program—DevelopScale
Electrify fleet and infrastructure—DevelopScale
Smart parking strategyLaunchDevelop—
Data, AI and continuous optimizationLaunchDevelopScale

Illustrative roadmap outcomes

+8%

Productivity

−15%

Mobility costs

−22%

CO₂ emissions

+18%

Employee satisfaction

Corporate campus with shuttle transport, cyclists and landscaped pedestrian routes
05

Mobility Intelligence Platform

One platform. A complete view. Real impact.

Turn fragmented mobility data into actionable insights for a more efficient, sustainable and people-centric organization.

Google Maps

Locations · Routes · Travel times · Points of interest

HR

Employee data · Work locations · Departments · Work patterns

Fleet

Vehicles · Usage · Maintenance · Costs · Emissions

Public transport

Schedules · Stops and lines · Real-time data · Disruptions
GPS / Telematics

Real-time location · Trip data · Distance and speed · Occupancy · Driver behaviour

Surveys

Travel behaviour · Preferences · Satisfaction · Needs · Open feedback

Buus

Mobility Intelligence

Integrate → Analyze → Understand → Predict → Optimize

▥ Dashboards

Clear insights, real-time visibility.

Mobility overview
12,480Employees68%Sustainable trips
678916171819

◎ AI

Turn data into intelligence.

AI insights
  • Identify shuttle capacity opportunities
  • Recommend stops based on demand
  • Anticipate changes in travel patterns
  • Find opportunities for carpooling

♧ Alerts

Be proactive, not reactive.

Active alerts
  • Service disruption
  • Low occupancy
  • Unusual trip ridership
  • Scheduled maintenance

⚙ Optimization

Better decisions. Greater impact.

Optimization scenarios

Illustrative interface panels

Secure & compliant

Your data is safe, compliant and handled with the highest security standards.

Open & flexible

Connect with existing systems and grow with your organization.

06

Performance Optimization

Mobility never stops improving.

A continuous cycle that turns insights into action and delivers increasing value over time.
A smarter
mobility future.
Every cycle.

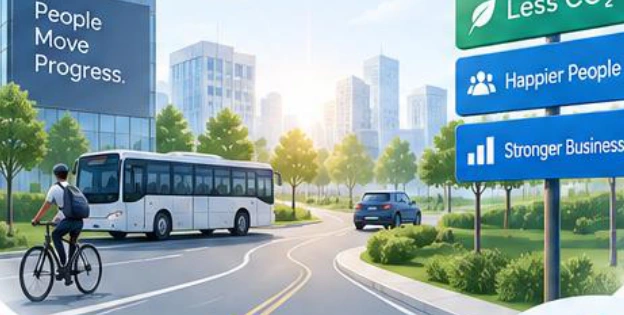
A people-centric city with corporate shuttle, cycling and greener mobility
1

Assessment

Understand your current mobility situation.

  • Data analysis
  • Stakeholder input
  • Opportunities
2

Maturity

Know where you stand and where you can grow.

  • Maturity assessment
  • Benchmarking
  • Clear improvement areas
3

Business Case

Quantify the value and build the case for action.

  • Cost-benefit analysis
  • CO₂ impact
  • Productivity gains
  • Employee experience
4

Strategy

Define the roadmap to achieve your goals.

  • Prioritized initiatives
  • Timeline and milestones
  • Governance and KPIs
5

Platform

Turn data into intelligence.

  • Integrate data sources
  • Dashboards & AI
  • Real-time insights
  • Alerts
6

Optimization

Take action and improve continuously.

  • Optimize routes and services
  • Increase occupancy
  • Reduce costs and emissions
  • Measure results
7

Assess again

New data. New insights. A higher level of maturity.

  • Measure progress
  • Capture new opportunities
  • Set next cycle goals

Continuous progress. Lasting impact.

Keep learning, adapting and improving—today and tomorrow.

Where should you start?

Your next step starts
with a clearer picture.

Understand your current Corporate Mobility maturity and identify your highest-value opportunities.

Start Your Mobility Assessment →Back to the journey overview ↑